> ## Documentation Index
> Fetch the complete documentation index at: https://docs.usefini.com/llms.txt
> Use this file to discover all available pages before exploring further.
# Analytics
> Measure how your agent performs in production: conversation volume, deflection, escalation reasons, CSAT, and sentiment, broken down by agent, intent, and intent rule.
Analytics tells you how your agent is doing in production. It covers the volume of conversations handled, the share the agent resolved without escalation, why conversations escalated when they did, how response time is trending, and what customers thought of the replies.
This is the page you read when a stakeholder asks *"is the agent working?"*, when you shipped a change and want to confirm it didn't regress deflection, or when you're prioritizing knowledge work and need to know which intents drive the most volume and the most failures.
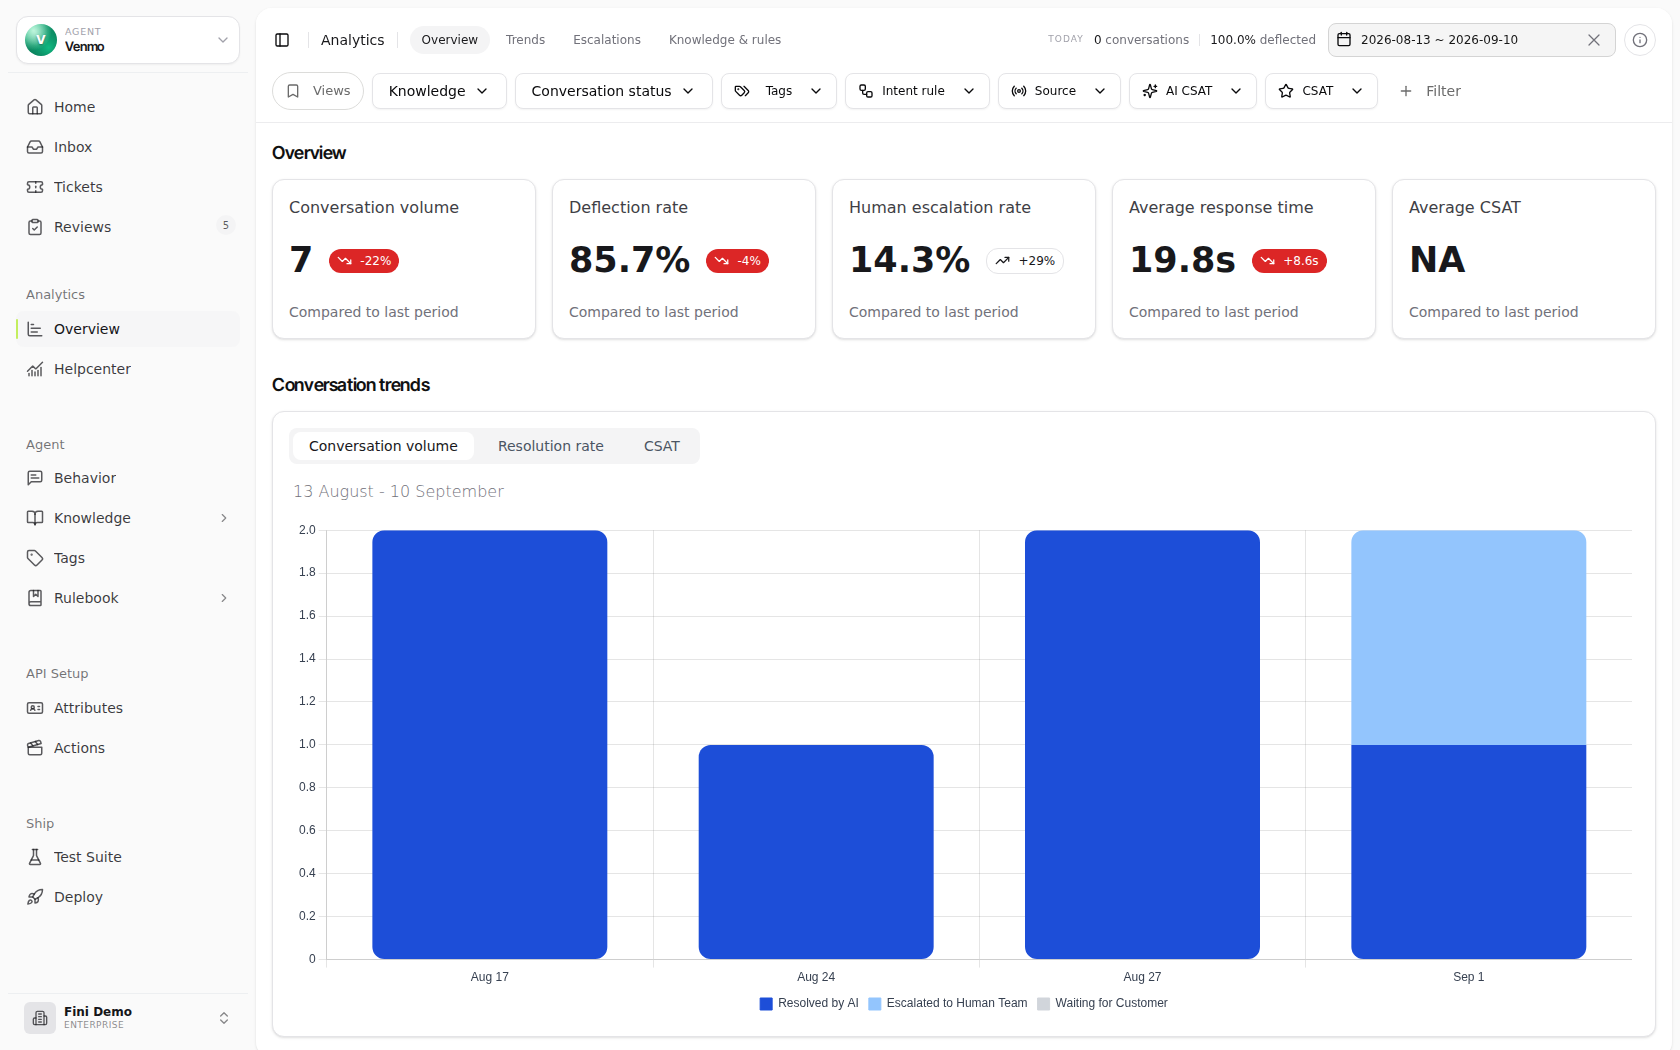 Analytics reads from the same conversations Fini handles live. Every number traces back to real conversations you can open in [Inbox](/en/testing/inbox), where the full [AI Steps trace](/en/automations/rulebook#observability-the-ai-steps-trace) shows exactly what the agent did. Analytics is the aggregate view; Inbox is the per-conversation view.
Everything on the page sits on one scrolling surface. The header keeps the agent, section shortcuts, date range, and filter row visible while you scroll, so you can move between the major Analytics sections without losing the current scope.
## Global controls
Most controls at the top of the page filter everything below them. The small *Today* pulse in the header is the exception: it always shows today's live conversation count and deflection rate for the selected agent, independent of the selected date range and filters.
### Agent picker
Top-left, beside the page title. Scopes every chart and table to the selected agent. Multi-agent workspaces use this to isolate a regression to the agent that caused it.
### Date range
Defaults to the last 7 days. Pick any custom window for spot analysis or longer-term trends. The selected range applies to every KPI card, chart, and table below the header. KPI change pills compare the selected window against the immediately preceding window of the same length.
### Filters
A row of filter pills sits under the page header. Core filters are pinned by default; optional filters live under the **+ Filter** dropdown. Filters compose, so combining *Channel = email* and *Sentiment = negative* isolates angry customers on the email channel specifically.
Use **Views** to save a filter setup you reuse, such as a weekly executive slice, a channel-specific review, or one team's intent-rule view. Saved views store filters only. Applying one keeps the current date range, so you can reuse the same slice across different reporting windows.
| Filter | Visibility | What it slices on |
| - | - | - |
| Knowledge | Pinned | Conversations matched against specific knowledge sources or articles. |
| Conversation status | Pinned | Resolved by AI, Escalated to Human Team, or Waiting for Customer. |
| Tags | Pinned | The intents and sub-intents that classify each conversation, configured in [Tags](/en/configuration/tags). |
| Intent rule | Pinned | The [Rulebook](/en/automations/rulebook) intent rule that handled the conversation. |
| Escalation reason | + Filter | If the conversation escalated, why. See the full taxonomy under [Escalation reasons](#escalation-reasons). |
| Source | Pinned | The integration the conversation came from: Zendesk, Intercom, widget, and so on. |
| CSAT | Pinned | One or more explicit star ratings. |
| AI CSAT | Pinned when available | AI-inferred CSAT tags, shown as star ratings when the production-only tag group is configured. |
| Sentiment | + Filter | The AI-inferred sentiment of the conversation: positive, neutral, negative. |
| Channel | + Filter | Email, chat, voice, and so on. |
## KPI cards
Five cards across the top summarize the period. Each shows a value and a colored pill indicating change versus the previous period of the same length.
| Metric | What it measures |
| - | - |
| Conversation volume | Total conversations the agent handled in the period. A large drop usually points to a connector outage or a change in upstream routing. |
| Deflection rate | Share of conversations the agent handled without human takeover. This is `100% - Human escalation rate`, so conversations still waiting on a customer count as deflected unless they escalated. |
| Human escalation rate | Share of conversations the agent escalated to a teammate. Moves inversely to deflection rate. |
| Average response time | Median time from the customer's message to the agent's reply. Sub-second on chat; seconds on email. |
| Average CSAT | Average customer satisfaction score across rated conversations in the period. |
**Three statuses, summing to 100%.** Every conversation ends in exactly one of three states: *Resolved by AI*, *Escalated to Human Team*, or *Waiting for Customer*. Deflection rate is the complement of Human escalation rate, while AI resolution rate counts only the conversations fully resolved by the agent. The [Conversation Status doughnut](#conversation-status) visualizes the full three-way split.
Average CSAT reads *NA* when CSAT collection isn't configured for the agent, or when no conversations in the range carry a rating. The card, the CSAT column in [Knowledge performance](#knowledge-performance) and [Intent rule breakdown](#intent-rule-breakdown), and the **CSAT** filter all populate once ratings start coming in. See [CSAT and sentiment](#csat-and-sentiment) for how ratings are captured.
## Trends
Conversation trend charts sit below the KPI cards.
### Conversation volume, Resolution rate, and CSAT
A toggle at the top of the first chart switches between trend views over the selected range:
* **Conversation volume**, total conversations per day. Use it to spot traffic spikes and drops.
* **Resolution rate**, the daily resolution rate plotted alongside the *Waiting for Customer* share. A drop in this trend right after a knowledge or prompt change is a strong signal to roll back or investigate.
* **CSAT**, daily customer satisfaction trend when CSAT data is available.
### Average response time
A dedicated chart plotting median response time per day across the same window. Use it to catch latency regressions, a steady climb often traces to a slow [Action](/en/api-reference/actions) the agent calls mid-conversation, which the response-time trend surfaces before it shows up in CSAT.
## Distribution
The distribution section breaks the period down by channel and by status, then shows channel-level detail below the charts.
Analytics reads from the same conversations Fini handles live. Every number traces back to real conversations you can open in [Inbox](/en/testing/inbox), where the full [AI Steps trace](/en/automations/rulebook#observability-the-ai-steps-trace) shows exactly what the agent did. Analytics is the aggregate view; Inbox is the per-conversation view.
Everything on the page sits on one scrolling surface. The header keeps the agent, section shortcuts, date range, and filter row visible while you scroll, so you can move between the major Analytics sections without losing the current scope.
## Global controls
Most controls at the top of the page filter everything below them. The small *Today* pulse in the header is the exception: it always shows today's live conversation count and deflection rate for the selected agent, independent of the selected date range and filters.
### Agent picker
Top-left, beside the page title. Scopes every chart and table to the selected agent. Multi-agent workspaces use this to isolate a regression to the agent that caused it.
### Date range
Defaults to the last 7 days. Pick any custom window for spot analysis or longer-term trends. The selected range applies to every KPI card, chart, and table below the header. KPI change pills compare the selected window against the immediately preceding window of the same length.
### Filters
A row of filter pills sits under the page header. Core filters are pinned by default; optional filters live under the **+ Filter** dropdown. Filters compose, so combining *Channel = email* and *Sentiment = negative* isolates angry customers on the email channel specifically.
Use **Views** to save a filter setup you reuse, such as a weekly executive slice, a channel-specific review, or one team's intent-rule view. Saved views store filters only. Applying one keeps the current date range, so you can reuse the same slice across different reporting windows.
| Filter | Visibility | What it slices on |
| - | - | - |
| Knowledge | Pinned | Conversations matched against specific knowledge sources or articles. |
| Conversation status | Pinned | Resolved by AI, Escalated to Human Team, or Waiting for Customer. |
| Tags | Pinned | The intents and sub-intents that classify each conversation, configured in [Tags](/en/configuration/tags). |
| Intent rule | Pinned | The [Rulebook](/en/automations/rulebook) intent rule that handled the conversation. |
| Escalation reason | + Filter | If the conversation escalated, why. See the full taxonomy under [Escalation reasons](#escalation-reasons). |
| Source | Pinned | The integration the conversation came from: Zendesk, Intercom, widget, and so on. |
| CSAT | Pinned | One or more explicit star ratings. |
| AI CSAT | Pinned when available | AI-inferred CSAT tags, shown as star ratings when the production-only tag group is configured. |
| Sentiment | + Filter | The AI-inferred sentiment of the conversation: positive, neutral, negative. |
| Channel | + Filter | Email, chat, voice, and so on. |
## KPI cards
Five cards across the top summarize the period. Each shows a value and a colored pill indicating change versus the previous period of the same length.
| Metric | What it measures |
| - | - |
| Conversation volume | Total conversations the agent handled in the period. A large drop usually points to a connector outage or a change in upstream routing. |
| Deflection rate | Share of conversations the agent handled without human takeover. This is `100% - Human escalation rate`, so conversations still waiting on a customer count as deflected unless they escalated. |
| Human escalation rate | Share of conversations the agent escalated to a teammate. Moves inversely to deflection rate. |
| Average response time | Median time from the customer's message to the agent's reply. Sub-second on chat; seconds on email. |
| Average CSAT | Average customer satisfaction score across rated conversations in the period. |
**Three statuses, summing to 100%.** Every conversation ends in exactly one of three states: *Resolved by AI*, *Escalated to Human Team*, or *Waiting for Customer*. Deflection rate is the complement of Human escalation rate, while AI resolution rate counts only the conversations fully resolved by the agent. The [Conversation Status doughnut](#conversation-status) visualizes the full three-way split.
Average CSAT reads *NA* when CSAT collection isn't configured for the agent, or when no conversations in the range carry a rating. The card, the CSAT column in [Knowledge performance](#knowledge-performance) and [Intent rule breakdown](#intent-rule-breakdown), and the **CSAT** filter all populate once ratings start coming in. See [CSAT and sentiment](#csat-and-sentiment) for how ratings are captured.
## Trends
Conversation trend charts sit below the KPI cards.
### Conversation volume, Resolution rate, and CSAT
A toggle at the top of the first chart switches between trend views over the selected range:
* **Conversation volume**, total conversations per day. Use it to spot traffic spikes and drops.
* **Resolution rate**, the daily resolution rate plotted alongside the *Waiting for Customer* share. A drop in this trend right after a knowledge or prompt change is a strong signal to roll back or investigate.
* **CSAT**, daily customer satisfaction trend when CSAT data is available.
### Average response time
A dedicated chart plotting median response time per day across the same window. Use it to catch latency regressions, a steady climb often traces to a slow [Action](/en/api-reference/actions) the agent calls mid-conversation, which the response-time trend surfaces before it shows up in CSAT.
## Distribution
The distribution section breaks the period down by channel and by status, then shows channel-level detail below the charts.
 ### Usage by channels
Conversation volume split by channel, typically Chat versus Email. Useful for sanity-checking that traffic lands on the channels you expect. A sudden shift from chat-dominant to email-dominant can mean the chat widget broke.
### Conversation Status
The three conversation statuses, *Resolved by AI*, *Escalated to Human Team*, and *Waiting for Customer*, as proportions of total volume. This is the visual form of the *three statuses sum to 100%* model from the Note above.
### Channel breakdown
The channel table sits below the doughnuts. It shows volume and quality by source channel, useful when one channel regresses while overall performance looks flat.
### Hourly breakdown
For ranges up to 31 days, Analytics shows volume by hour and resolution rate by hour. Use this to spot staffing or routing gaps: a healthy daily average can still hide a specific hour where resolution falls off.
## Escalations
When the agent escalates, this section tells you why. Read it when deflection rate is too low: the KPI cards tell you *that* it's low, the escalation breakdown tells you *what to fix*.
### Usage by channels
Conversation volume split by channel, typically Chat versus Email. Useful for sanity-checking that traffic lands on the channels you expect. A sudden shift from chat-dominant to email-dominant can mean the chat widget broke.
### Conversation Status
The three conversation statuses, *Resolved by AI*, *Escalated to Human Team*, and *Waiting for Customer*, as proportions of total volume. This is the visual form of the *three statuses sum to 100%* model from the Note above.
### Channel breakdown
The channel table sits below the doughnuts. It shows volume and quality by source channel, useful when one channel regresses while overall performance looks flat.
### Hourly breakdown
For ranges up to 31 days, Analytics shows volume by hour and resolution rate by hour. Use this to spot staffing or routing gaps: a healthy daily average can still hide a specific hour where resolution falls off.
## Escalations
When the agent escalates, this section tells you why. Read it when deflection rate is too low: the KPI cards tell you *that* it's low, the escalation breakdown tells you *what to fix*.
 ### Escalation reasons
Every escalated conversation is tagged with a reason from a fixed taxonomy. The reasons group into four families. Knowing which reasons drive escalation tells you exactly where to spend effort.
| Family | Reason | What it means | What to do about it |
| - | - | - | - |
| Knowledge | Missing Knowledge | The agent had no content to answer the question. | Add [Articles or Sources](/en/knowledge/sources) covering the gap. |
| Knowledge | Conflicting Knowledge | Two knowledge sources gave contradictory answers. | Audit for conflicts; pick the authoritative source. |
| Knowledge | Partially Available | Some of the information was available; some wasn't. | Complete the knowledge, or add a Rulebook flow that handles the partial case. |
| Action | Missing API Access | The agent needed an external system that wasn't connected. | Wire up the [Action](/en/api-reference/actions) the agent needed. |
| Action | API or System Failure | An Action or integration call failed at runtime. | Check the [AI Steps trace](/en/automations/rulebook#observability-the-ai-steps-trace) on the failing conversation, then the underlying API. |
| User | Customer requested human – immediately | The customer asked for a human on their first message. | Often unavoidable, but spikes can mean the intro message is off-putting. |
| User | Customer requested human – after attempt | The customer tried the agent first, then asked for a human. | The most actionable category. Read these to find what frustrated them. |
| User | Ambiguous or Unclear Input | The agent couldn't understand the message well enough to act. | Tighten [Rulebook](/en/automations/rulebook) intent gates, or add a clarifying-question flow. |
| Policy | Escalation Constraint | A policy in your Rulebook prevented the agent from acting. | Expected in most cases; audit if a category is unexpectedly high. |
| Policy | Guardrail or Safety Trigger | A safety check (PII, prohibited content) forced the escalation. | Expected behavior; investigate only if the pattern suggests false positives. |
### The escalation doughnut
The center count is the total number of conversations in the period, not just the escalated ones. The largest segment, *Not escalated*, covers everything the agent resolved without escalating. The remaining segments break the escalated conversations down by reason, colored by family. Big non-grey segments are your top fix-it targets.
Because the doughnut includes *Not escalated*, that slice dominates a healthy chart. To read escalation reasons against each other rather than against the resolved baseline, scan the smaller segments and the legend, or apply the *Escalation reason* filter to drill into one.
## CSAT and sentiment
Two feedback signals run alongside each other across the page: what customers explicitly said, and what their words imply.
| Signal | Source | Captures |
| - | - | - |
| CSAT | The customer explicitly rates the conversation (thumbs up or down in the widget, a post-conversation survey, and so on). | What the customer *said* they thought. |
| Sentiment | Fini's model reads the customer's messages and infers sentiment from tone. | What the customer's words *suggest* they thought. |
The two often diverge. A customer might end on a thumbs-up after a frustrating multi-turn exchange (high CSAT, low sentiment), or get a fast answer and never bother rating it (high sentiment, no CSAT). Reading both is more honest than either alone.
Where each signal shows up on the page: CSAT drives the [Average CSAT](#kpi-cards) card, the CSAT trend, the CSAT columns in [Knowledge performance](#knowledge-performance) and [Intent rule breakdown](#intent-rule-breakdown), and the **CSAT** filter. Sentiment is available as a filter under **+ Filter** and informs the per-conversation view in [Inbox](/en/testing/inbox). When CSAT isn't configured, the CSAT surfaces read *NA* and sentiment carries the feedback signal on its own.
## Breakdowns
Two tables break the period down: one by knowledge usage, one by intent rule.
### Knowledge performance
A table breaking conversations down by **knowledge usage**. It shows which folders, articles, or source groups the agent used and how each slice performed.
### Escalation reasons
Every escalated conversation is tagged with a reason from a fixed taxonomy. The reasons group into four families. Knowing which reasons drive escalation tells you exactly where to spend effort.
| Family | Reason | What it means | What to do about it |
| - | - | - | - |
| Knowledge | Missing Knowledge | The agent had no content to answer the question. | Add [Articles or Sources](/en/knowledge/sources) covering the gap. |
| Knowledge | Conflicting Knowledge | Two knowledge sources gave contradictory answers. | Audit for conflicts; pick the authoritative source. |
| Knowledge | Partially Available | Some of the information was available; some wasn't. | Complete the knowledge, or add a Rulebook flow that handles the partial case. |
| Action | Missing API Access | The agent needed an external system that wasn't connected. | Wire up the [Action](/en/api-reference/actions) the agent needed. |
| Action | API or System Failure | An Action or integration call failed at runtime. | Check the [AI Steps trace](/en/automations/rulebook#observability-the-ai-steps-trace) on the failing conversation, then the underlying API. |
| User | Customer requested human – immediately | The customer asked for a human on their first message. | Often unavoidable, but spikes can mean the intro message is off-putting. |
| User | Customer requested human – after attempt | The customer tried the agent first, then asked for a human. | The most actionable category. Read these to find what frustrated them. |
| User | Ambiguous or Unclear Input | The agent couldn't understand the message well enough to act. | Tighten [Rulebook](/en/automations/rulebook) intent gates, or add a clarifying-question flow. |
| Policy | Escalation Constraint | A policy in your Rulebook prevented the agent from acting. | Expected in most cases; audit if a category is unexpectedly high. |
| Policy | Guardrail or Safety Trigger | A safety check (PII, prohibited content) forced the escalation. | Expected behavior; investigate only if the pattern suggests false positives. |
### The escalation doughnut
The center count is the total number of conversations in the period, not just the escalated ones. The largest segment, *Not escalated*, covers everything the agent resolved without escalating. The remaining segments break the escalated conversations down by reason, colored by family. Big non-grey segments are your top fix-it targets.
Because the doughnut includes *Not escalated*, that slice dominates a healthy chart. To read escalation reasons against each other rather than against the resolved baseline, scan the smaller segments and the legend, or apply the *Escalation reason* filter to drill into one.
## CSAT and sentiment
Two feedback signals run alongside each other across the page: what customers explicitly said, and what their words imply.
| Signal | Source | Captures |
| - | - | - |
| CSAT | The customer explicitly rates the conversation (thumbs up or down in the widget, a post-conversation survey, and so on). | What the customer *said* they thought. |
| Sentiment | Fini's model reads the customer's messages and infers sentiment from tone. | What the customer's words *suggest* they thought. |
The two often diverge. A customer might end on a thumbs-up after a frustrating multi-turn exchange (high CSAT, low sentiment), or get a fast answer and never bother rating it (high sentiment, no CSAT). Reading both is more honest than either alone.
Where each signal shows up on the page: CSAT drives the [Average CSAT](#kpi-cards) card, the CSAT trend, the CSAT columns in [Knowledge performance](#knowledge-performance) and [Intent rule breakdown](#intent-rule-breakdown), and the **CSAT** filter. Sentiment is available as a filter under **+ Filter** and informs the per-conversation view in [Inbox](/en/testing/inbox). When CSAT isn't configured, the CSAT surfaces read *NA* and sentiment carries the feedback signal on its own.
## Breakdowns
Two tables break the period down: one by knowledge usage, one by intent rule.
### Knowledge performance
A table breaking conversations down by **knowledge usage**. It shows which folders, articles, or source groups the agent used and how each slice performed.
 For each row, the table shows:
* **AI Resolve Rate**, share of conversations in that row the agent resolved.
* **Escalated Rate**, share that escalated to a human.
* **CSAT**, the CSAT rate for that row, as a color-graded pill. Reads *NA* when CSAT isn't configured.
* **Volume**, total conversations, with a pill showing change versus the previous period.
This is one of the most actionable views on the page. A high-volume knowledge slice with a low resolve rate is your highest-leverage target: it tells you what to fix in [Knowledge](/en/knowledge/sources) next. The arrow on the right of a row opens the conversations behind it in [Inbox](/en/testing/inbox), useful for spot-checking what went wrong.
The CSAT pill uses three color bands, so a row that reads red across CSAT is a clear *fix this first* signal:
| Pill color | Range | Reading |
| - | - | - |
| Red | Low | Needs attention. Customers signal dissatisfaction. |
| Amber | Middle | Watch this. Not broken, not great. |
| Green | High | Healthy. The agent performs well on this intent. |
### Intent rule breakdown
A table breaking performance down by [Rulebook](/en/automations/rulebook) intent rule, the rules that decide how the agent handles each class of request. Columns:
* **Intent rule**, the rule name as it appears in your Rulebook.
* **AI Resolve Rate**, share of conversations the rule handled that resolved without escalation.
* **Escalated Rate**, share that escalated.
* **Volume**, total conversations the rule handled.
For each row, the table shows:
* **AI Resolve Rate**, share of conversations in that row the agent resolved.
* **Escalated Rate**, share that escalated to a human.
* **CSAT**, the CSAT rate for that row, as a color-graded pill. Reads *NA* when CSAT isn't configured.
* **Volume**, total conversations, with a pill showing change versus the previous period.
This is one of the most actionable views on the page. A high-volume knowledge slice with a low resolve rate is your highest-leverage target: it tells you what to fix in [Knowledge](/en/knowledge/sources) next. The arrow on the right of a row opens the conversations behind it in [Inbox](/en/testing/inbox), useful for spot-checking what went wrong.
The CSAT pill uses three color bands, so a row that reads red across CSAT is a clear *fix this first* signal:
| Pill color | Range | Reading |
| - | - | - |
| Red | Low | Needs attention. Customers signal dissatisfaction. |
| Amber | Middle | Watch this. Not broken, not great. |
| Green | High | Healthy. The agent performs well on this intent. |
### Intent rule breakdown
A table breaking performance down by [Rulebook](/en/automations/rulebook) intent rule, the rules that decide how the agent handles each class of request. Columns:
* **Intent rule**, the rule name as it appears in your Rulebook.
* **AI Resolve Rate**, share of conversations the rule handled that resolved without escalation.
* **Escalated Rate**, share that escalated.
* **Volume**, total conversations the rule handled.
 A rule with a low resolve rate and a high escalated rate is leaking conversations to humans, look at whether it's missing an [Action](/en/api-reference/actions), missing knowledge, or gated too tightly. This is the live, production counterpart to the regression results in [Test Suite](/en/testing/test-suite): Test Suite tells you whether a rule passes its tests, this table tells you how it behaves on real traffic.
## Common workflows
### Weekly health check
1. Set the date range to the last 7 days.
2. Glance at the KPI cards; compare deflection rate to last week.
3. Check the Resolution rate trend for sharp drops; correlate with deploys or knowledge changes.
4. Skim Knowledge performance and Intent rules for any row that regressed; use the row arrow to open those conversations and spot-check.
### Pre-release validation
1. Set the date range to the period since you started rolling out a change (for example, the last 24 hours after a prompt edit).
2. Compare deflection rate, Average response time, and Average CSAT against the prior period.
3. If any worsened, roll back. If all are flat or better, continue rolling out.
### Knowledge prioritization
1. Open Knowledge performance. Find a knowledge slice with high volume and low AI Resolve Rate.
2. Filter by *Escalation reason* for that slice and see which reasons dominate.
3. If Missing Knowledge leads, add [Articles or Sources](/en/knowledge/sources). If Ambiguous or Unclear Input leads, tighten the [Rulebook](/en/automations/rulebook).
4. Check the same intent the following week. AI Resolve Rate should rise and the escalation reason should shrink.
### Diagnosing a CSAT drop
1. Apply the **CSAT** filter, or sort Knowledge performance and Intent rules by CSAT, to find which slices drove the drop.
2. Compare CSAT against sentiment. If both fell together, customers genuinely got worse outcomes, go to the escalation breakdown to see why.
3. If CSAT fell but sentiment held, something about *how* the agent communicated changed, check recent [Prompts](/en/configuration/prompts) edits.
4. Open the affected conversations in [Inbox](/en/testing/inbox) and read ten of them to find the pattern.
## What's not in Analytics
A few things this page doesn't surface; you go elsewhere for them:
* **Per-conversation debugging**, that's [Inbox](/en/testing/inbox), with the full [AI Steps trace](/en/automations/rulebook#observability-the-ai-steps-trace) per conversation.
* **Test pass rates**, whether an intent rule passes its regression tests, that's [Test Suite](/en/testing/test-suite). The [Intent rule breakdown](#intent-rule-breakdown) above shows live resolve, escalate, and volume per rule; Test Suite shows pass or fail against your test cases.
* **Cost and token usage**, tracked in workspace settings, not in Analytics.
## Related
Open individual conversations from any Analytics chart to debug them. Every conversation has a full AI Steps execution trace.
The tags that drive analytics filters and conversation breakdowns are configured here.
The intent rules measured in the Intent rule breakdown are built and edited here.
Run regression tests before publishing changes that Analytics will eventually measure.
## Related topics
- [Get agent analytics](/en/api-reference/get-agent-analytics.md)
- [Get agent analytics section](/en/api-reference/get-agent-analytics-section.md)
- [API overview](/en/api-reference/overview.md)
This documentation is built and hosted on [Mintlify](https://mintlify.com), a developer documentation platform.
A rule with a low resolve rate and a high escalated rate is leaking conversations to humans, look at whether it's missing an [Action](/en/api-reference/actions), missing knowledge, or gated too tightly. This is the live, production counterpart to the regression results in [Test Suite](/en/testing/test-suite): Test Suite tells you whether a rule passes its tests, this table tells you how it behaves on real traffic.
## Common workflows
### Weekly health check
1. Set the date range to the last 7 days.
2. Glance at the KPI cards; compare deflection rate to last week.
3. Check the Resolution rate trend for sharp drops; correlate with deploys or knowledge changes.
4. Skim Knowledge performance and Intent rules for any row that regressed; use the row arrow to open those conversations and spot-check.
### Pre-release validation
1. Set the date range to the period since you started rolling out a change (for example, the last 24 hours after a prompt edit).
2. Compare deflection rate, Average response time, and Average CSAT against the prior period.
3. If any worsened, roll back. If all are flat or better, continue rolling out.
### Knowledge prioritization
1. Open Knowledge performance. Find a knowledge slice with high volume and low AI Resolve Rate.
2. Filter by *Escalation reason* for that slice and see which reasons dominate.
3. If Missing Knowledge leads, add [Articles or Sources](/en/knowledge/sources). If Ambiguous or Unclear Input leads, tighten the [Rulebook](/en/automations/rulebook).
4. Check the same intent the following week. AI Resolve Rate should rise and the escalation reason should shrink.
### Diagnosing a CSAT drop
1. Apply the **CSAT** filter, or sort Knowledge performance and Intent rules by CSAT, to find which slices drove the drop.
2. Compare CSAT against sentiment. If both fell together, customers genuinely got worse outcomes, go to the escalation breakdown to see why.
3. If CSAT fell but sentiment held, something about *how* the agent communicated changed, check recent [Prompts](/en/configuration/prompts) edits.
4. Open the affected conversations in [Inbox](/en/testing/inbox) and read ten of them to find the pattern.
## What's not in Analytics
A few things this page doesn't surface; you go elsewhere for them:
* **Per-conversation debugging**, that's [Inbox](/en/testing/inbox), with the full [AI Steps trace](/en/automations/rulebook#observability-the-ai-steps-trace) per conversation.
* **Test pass rates**, whether an intent rule passes its regression tests, that's [Test Suite](/en/testing/test-suite). The [Intent rule breakdown](#intent-rule-breakdown) above shows live resolve, escalate, and volume per rule; Test Suite shows pass or fail against your test cases.
* **Cost and token usage**, tracked in workspace settings, not in Analytics.
## Related
Open individual conversations from any Analytics chart to debug them. Every conversation has a full AI Steps execution trace.
The tags that drive analytics filters and conversation breakdowns are configured here.
The intent rules measured in the Intent rule breakdown are built and edited here.
Run regression tests before publishing changes that Analytics will eventually measure.
## Related topics
- [Get agent analytics](/en/api-reference/get-agent-analytics.md)
- [Get agent analytics section](/en/api-reference/get-agent-analytics-section.md)
- [API overview](/en/api-reference/overview.md)
This documentation is built and hosted on [Mintlify](https://mintlify.com), a developer documentation platform.